Remote Product Analyst Jobs: Complete 2026 Career Guide
Everything you need to land a remote product analyst job. Metrics, A/B testing, experimentation - salary data, interview questions, and companies hiring.
Updated January 20, 2026 • Verified current for 2026
Remote product analysts are the data-driven backbone of product decision-making, transforming raw metrics into actionable insights that shape product strategy and drive business outcomes. In 2026, remote product analyst salaries range from $70,000 to $230,000+ for US-based positions, with senior analysts and directors at top tech companies earning $200,000-$250,000+ in total compensation including equity. The role requires expertise in SQL, A/B testing, experimentation frameworks, and product metrics, combined with the ability to communicate findings to cross-functional stakeholders. Product analytics is exceptionally well-suited for remote work because the deliverables are tangible (dashboards, analyses, insights), collaboration is primarily async-friendly, and impact is measurable through clear metrics. To land a remote product analyst role, you need strong SQL proficiency, experience with analytics platforms like Amplitude or Mixpanel, statistical knowledge for experiment design, and the ability to tell compelling data stories that influence product decisions.
What Do Remote Product Analysts Actually Do?
Remote product analysts sit at the critical intersection of data science and product management, serving as the quantitative compass that guides product decisions. While data analysts might work across various business functions, product analysts focus specifically on understanding user behavior, measuring product performance, and designing experiments to optimize product outcomes.
Day-to-Day Responsibilities
The daily work of a remote product analyst combines technical data work with strategic product thinking and cross-functional collaboration.
Defining and Tracking Product Metrics forms the foundation of product analytics work. You establish the key performance indicators (KPIs) that measure product success, from activation rates and feature adoption to retention curves and revenue metrics. This involves working with product managers to align on what success looks like, creating measurement frameworks that capture user value, and building dashboards that provide visibility into product health. In remote settings, well-documented metrics definitions become essential since teammates across time zones need to interpret data consistently without real-time clarification.
A/B Testing and Experimentation represents one of the most valuable contributions product analysts make. You design experiments to test product hypotheses, calculate required sample sizes, analyze results with statistical rigor, and communicate findings that inform launch decisions. This includes setting up proper control and treatment groups, monitoring experiments for anomalies, and determining when results reach statistical significance. Experimentation is inherently asynchronous since experiments run over days or weeks, making it ideal for remote work.
User Behavior Analysis involves deep dives into how users interact with your product. You analyze funnel conversion rates, identify drop-off points, segment users by behavior patterns, and uncover insights that explain why metrics move. This work often involves complex SQL queries, cohort analysis, and retention modeling to understand the user journey from acquisition through long-term engagement.
Product Launch Support means partnering with product managers throughout the product development lifecycle. Before launch, you establish baseline metrics and define success criteria. During launch, you monitor real-time performance and flag issues. After launch, you conduct post-mortems analyzing what worked, what did not, and what the team should learn for future releases.
Insight Communication and Storytelling transforms data into decisions. You create presentations, write analysis documents, and build self-serve dashboards that help stakeholders understand user behavior and product performance. The ability to translate complex analytical findings into clear recommendations distinguishes product analysts who drive impact from those who merely produce reports.
Stakeholder Partnership involves regular collaboration with product managers, engineers, designers, and executives. You participate in product planning, provide data perspectives on roadmap prioritization, and help teams understand the quantitative impact of their decisions. In remote environments, this partnership happens through structured meetings, async documentation, and proactive sharing of relevant insights.
Why Product Analytics Is Ideal for Remote Work
Product analytics ranks among the most remote-compatible roles in tech for several compelling reasons.
Deliverables Are Tangible and Measurable: Unlike roles where impact is subjective, product analysts produce concrete outputs: dashboards, analyses, experiment results, and insight documents. Remote managers can evaluate performance based on the quality and impact of these deliverables rather than relying on physical presence.
Async-Friendly Workflows: Much of product analytics work is independent. Querying data, building dashboards, analyzing experiments, and writing up findings can happen on your own schedule. While collaboration with stakeholders requires some synchronous time, the core analytical work adapts well to async patterns.
Strong Documentation Culture: Analytics teams have always valued documentation because analyses need to be reproducible and findings need to be accessible to stakeholders who did not participate in the work. This documentation mindset translates naturally to remote work where written communication is paramount.
Cloud-Based Tooling: Modern product analytics happens entirely in the cloud. Whether you are using Amplitude, Mixpanel, BigQuery, or Tableau, you access the same tools from anywhere. There is no difference between working from company headquarters or from a home office across the world.
Clear Impact Attribution: When your analysis influences a product decision that improves metrics, the impact is visible and quantifiable. Remote product analysts can demonstrate value through measurable outcomes without relying on face time or political visibility.
Product Analyst vs Data Analyst vs Product Manager
Understanding how product analysts differ from related roles helps you target the right opportunities and position your skills effectively.
Product Analysts focus specifically on understanding and optimizing product performance. Your stakeholders are primarily product managers and engineers building user-facing products. Your work centers on user behavior, feature adoption, experiments, and product metrics. You need deep product context and often work embedded within product teams.
Data Analysts (sometimes called Business Analysts or Business Intelligence Analysts) work across broader business functions. You might analyze marketing campaign performance, operational efficiency, financial metrics, or customer support trends. The work is less product-specific and may involve reporting for executives or supporting multiple departments.
Product Managers own product strategy and execution. They decide what to build based on user needs, business goals, and technical constraints. Product analysts inform PM decisions with data, but PMs own the final calls on prioritization, roadmap, and product direction. Some product analysts transition to PM roles after building product judgment through analytical work.
The boundaries between these roles vary by company. At some organizations, “data analyst” and “product analyst” are used interchangeably. At others, product analysts are embedded in product teams while data analysts sit in centralized analytics organizations. Research specific companies to understand their terminology and team structures.
Who Thrives as a Remote Product Analyst
Remote product analytics suits people with specific combinations of analytical aptitude and interpersonal skills.
Curious problem solvers who enjoy investigating why metrics move and discovering unexpected patterns in user behavior thrive in this role. The work rewards intellectual curiosity and the persistence to dig deeper when initial analysis raises more questions.
Strong communicators excel because data without context is just numbers. You need to translate statistical findings into plain language recommendations that non-technical stakeholders can understand and act upon. Written communication is especially important in remote settings where you cannot rely on in-person explanations.
Detail-oriented thinkers succeed because analytics work requires precision. Mistakes in SQL queries, statistical calculations, or data interpretation can lead to incorrect business decisions. You need to verify your work, document your methodology, and acknowledge uncertainty appropriately.
Self-directed learners adapt well because the analytics landscape evolves constantly. New tools, techniques, and best practices emerge regularly, and you need intrinsic motivation to stay current without external prompting.
Collaboratively minded independents balance solo analytical work with effective teamwork. You need to work independently on complex analyses while also partnering effectively with PMs, engineers, and other stakeholders who depend on your insights.
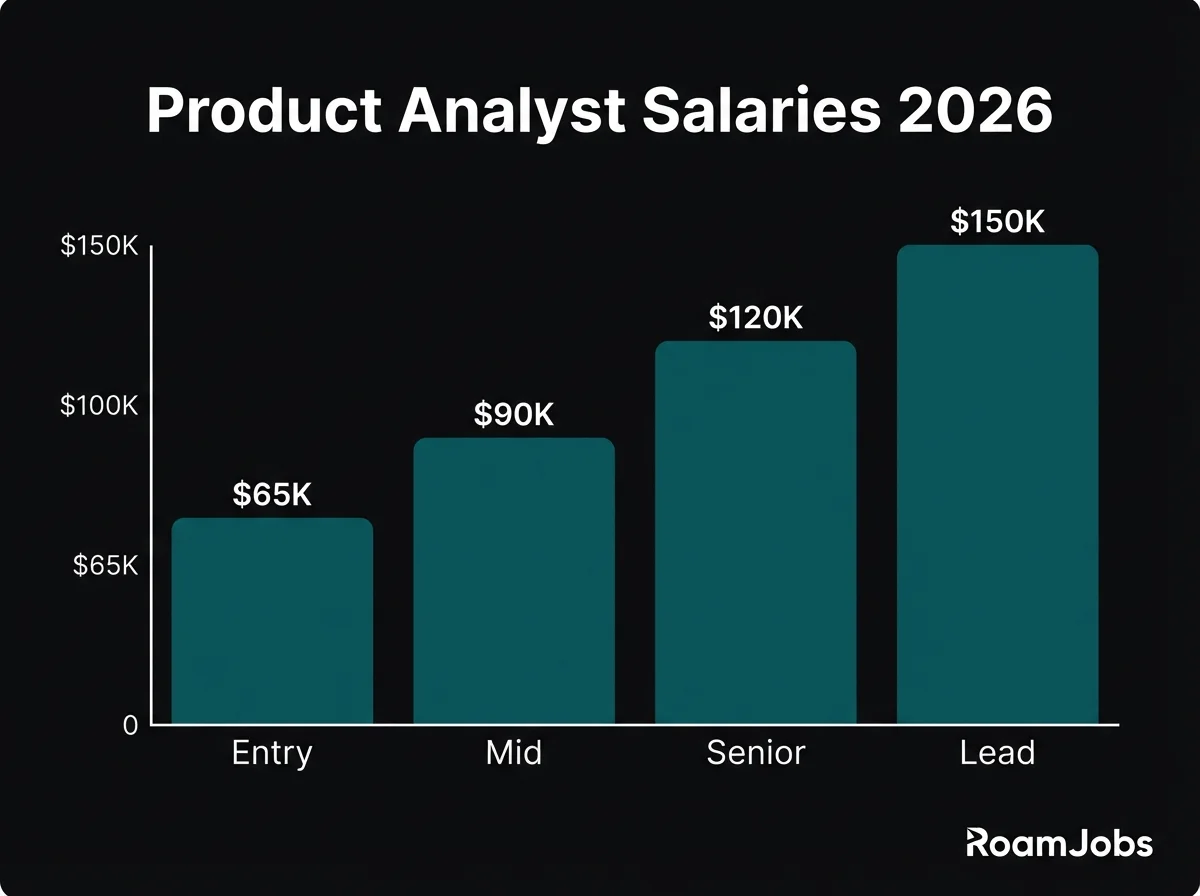
Salary Breakdown by Seniority
Understanding compensation expectations at each career level helps you negotiate effectively and plan your career trajectory. These figures represent remote positions with US-based companies, which typically offer the highest compensation in the global remote market.
Product Analyst Salary by Experience & Location
| Level | | | 🌎 LATAM | 🌏 Asia |
|---|---|---|---|---|
| Entry Level (0-2 yrs) | $70,000 - $92,000 | $45,000 - $62,000 | $28,000 - $48,000 | $22,000 - $42,000 |
| Mid-Level (2-5 yrs) | $95,000 - $130,000 | $62,000 - $92,000 | $45,000 - $75,000 | $38,000 - $65,000 |
| Senior (5-8 yrs) | $130,000 - $175,000 | $90,000 - $130,000 | $70,000 - $110,000 | $58,000 - $95,000 |
| Director/Principal (8+ yrs) | $165,000 - $230,000 | $120,000 - $175,000 | $95,000 - $150,000 | $80,000 - $130,000 |
* Salaries represent base compensation for remote positions. Actual compensation may vary based on company, experience, and specific location within region.
Entry Level / Junior Product Analyst
0-2 years experience
Skills Expected at Entry Level
Entry-level remote product analysts should demonstrate competency in foundational technical and analytical areas. First, you need proficient SQL skills including complex joins, subqueries, window functions, and aggregations. You should be able to write queries that answer business questions and debug queries that are not returning expected results.
Basic statistical knowledge is essential, including understanding of descriptive statistics (mean, median, standard deviation), distributions, correlation, and the fundamentals of hypothesis testing. You do not need a statistics degree, but you should understand when results are statistically meaningful.
Analytics tool familiarity means experience with at least one product analytics platform like Amplitude, Mixpanel, Heap, or Google Analytics 4. You should understand event tracking, funnel analysis, and basic segmentation.
Data visualization skills enable you to create clear charts and dashboards that communicate findings effectively. Proficiency in at least one visualization tool (Tableau, Looker, Metabase) demonstrates your ability to make data accessible.
Spreadsheet proficiency in Excel or Google Sheets for quick analysis, data manipulation, and presentation remains valuable even with more sophisticated tools available.
Communication skills help you explain your analytical findings to stakeholders who may not have technical backgrounds. Clear writing and presentation abilities matter even at entry level.
Common Entry-Level Titles
- Junior Product Analyst
- Product Analyst I
- Associate Product Analyst
- Analytics Associate
- Data Analyst, Product (Junior)
- Business Intelligence Analyst I
How to Break Into Product Analytics
Build a portfolio demonstrating product thinking. Create projects analyzing real product data (many datasets are publicly available) with a product lens. Show funnel analysis, cohort retention, or experiment design, not just generic data analysis. Document your thinking process and the product implications of your findings.
Develop strong SQL skills through consistent practice. LeetCode, Mode Analytics tutorials, and StrataScratch offer product-relevant SQL practice. Aim to solve complex queries confidently, not just basic aggregations.
Learn a product analytics platform. Amplitude and Mixpanel offer free tiers and certification programs. Building projects with these tools demonstrates role-specific skills that generic data analysis experience does not.
Gain product context by working on products, even side projects. Understanding the product development process, user journeys, and product metrics frameworks helps you speak the language of product teams.
Network in product analytics communities. Join Slack groups, attend virtual meetups, and engage with product analytics content on LinkedIn and Twitter. Building relationships in the field surfaces opportunities and provides mentorship.
Consider adjacent roles as stepping stones. Data analyst or business analyst positions can provide the analytical foundation for transitioning to product analytics. Look for roles with product-adjacent work where you can build relevant experience.
Mid-Level Product Analyst
2-5 years experience
Skills Expected at Mid-Level
Mid-level remote product analysts have moved beyond fundamentals and demonstrate ownership and strategic thinking. Advanced SQL and data manipulation means you can write complex queries efficiently, optimize query performance, and work with large datasets without guidance. You understand data modeling and can work across multiple data sources.
Experimentation expertise becomes critical at this level. You should design A/B tests with proper statistical power, calculate sample sizes, analyze results accounting for multiple comparisons, and identify when experiment results are confounded or unreliable. You understand common experimentation pitfalls and how to avoid them.
Statistical depth includes confidence intervals, significance testing, regression basics, and understanding variance and effect sizes. You should know when to apply different statistical methods and interpret results appropriately.
Product metrics frameworks mean you can design measurement strategies for new features or products. You understand frameworks like HEART (Happiness, Engagement, Adoption, Retention, Task success) or North Star metrics and can adapt them to specific contexts.
Cross-functional influence involves working effectively with product managers, engineers, and executives. You proactively identify analytical opportunities, not just respond to requests. You advocate for data-driven decision-making and help teams develop analytical intuition.
Documentation and knowledge scaling means creating resources that help others access insights without your direct involvement. You build self-serve dashboards, write clear analysis documentation, and establish standards that improve team effectiveness.
What Companies Expect
At the mid-level, companies expect you to own analytical outcomes for your product area. You should translate product questions into analytical approaches without detailed guidance, proactively identify opportunities and risks in your metrics, and deliver insights that influence product decisions.
Mentoring junior analysts becomes part of your role. You review their work, help them develop skills, and share knowledge that elevates team capabilities.
You should contribute to analytical infrastructure and best practices. This might include improving data pipelines, creating reusable analysis templates, or establishing experimentation standards that benefit the broader team.
Proactive communication matters significantly in remote settings. You should share relevant insights with stakeholders before they ask, flag concerning metric movements promptly, and maintain visibility into your work and impact.
Career Growth at Mid-Level
Focus on deepening product domain expertise while broadening analytical capabilities. Understand your product area deeply enough to anticipate analytical needs and identify opportunities others might miss.
Seek out high-visibility projects that demonstrate strategic impact. Work on launches, key experiments, and analyses that influence significant product decisions.
Develop specializations that differentiate you. This might include experimentation methodology, causal inference, machine learning for product analytics, or specific domain expertise (growth, monetization, engagement).
Build relationships across the organization. Product analysts who influence decisions do so through trusted relationships with product managers, engineers, and executives.
Senior Product Analyst
5-8 years experience
Skills Expected at Senior Level
Senior remote product analysts demonstrate mastery and leadership across analytical domains. Experimentation leadership means you design the experimentation strategy for your product area, establish best practices, and mentor others on rigorous methodology. You handle complex scenarios like sequential testing, multi-armed bandits, or experiments with network effects.
Advanced causal inference goes beyond simple A/B tests. You understand techniques like difference-in-differences, regression discontinuity, instrumental variables, and propensity score matching for situations where randomized experiments are not possible.
Strategic analytical thinking enables you to shape product strategy through data. You identify the right questions to answer, not just analyze the questions others ask. You understand business context deeply enough to prioritize analytical work that drives the highest impact.
Technical leadership involves making decisions about analytical infrastructure, tools, and methodologies. You evaluate new tools, establish standards, and ensure the analytical foundation supports the team’s needs.
Executive communication requires presenting complex analytical findings to senior leadership in compelling, actionable ways. You tailor communication to audience needs and advocate effectively for data-driven decisions at the highest levels.
Cross-functional leadership means influencing product direction without direct authority. You partner with senior product managers and engineers as a peer, contributing to strategic discussions and shaping product roadmaps through analytical insight.
Senior-Level Responsibilities
As a senior product analyst, you will lead analytical strategy for significant product areas or initiatives. This includes defining measurement frameworks, establishing success criteria, and ensuring teams have the data insights they need to succeed.
Mentor and develop junior and mid-level analysts. Provide code reviews, guide career development, and help others build the skills and judgment needed for advancement.
Drive analytical excellence across the team. Identify opportunities to improve practices, introduce new methodologies, and ensure analytical work meets high standards of rigor and impact.
Handle ambiguous problems that do not have clear analytical approaches. Senior analysts thrive when given open-ended questions and the autonomy to determine how to answer them.
Influence product strategy through insights and recommendations. Your analyses should shape prioritization decisions, identify new opportunities, and help teams understand user needs at a deeper level.
Path to Director/Principal
Transitioning from senior to director or principal level requires expanding your scope of impact. While senior analysts typically own analytics for specific product areas, directors influence analytics strategy across multiple teams or the entire product organization.
Develop organizational leadership capabilities. This means building and managing teams, setting strategy across product areas, and representing analytics in executive discussions.
Build cross-team influence by establishing practices and standards that improve analytical work organization-wide. Share knowledge, create tooling, and mentor analysts across teams.
Demonstrate business impact at a strategic level. Director-level analysts connect their work to company objectives and can articulate the business value of analytical investments.
Consider whether you want to pursue people management (managing a team of analysts) or individual contributor leadership (principal analyst influencing through expertise without direct reports). Both paths lead to director-level compensation and impact.
Lead / Director Product Analyst
8-12 years experience
Skills Expected at Director/Principal Level
Director and principal-level product analysts combine deep expertise with strategic leadership. Analytical vision and strategy means defining how analytics supports product strategy across the organization. You determine investment priorities, build the case for analytical capabilities, and ensure teams have what they need to make data-driven decisions.
Organizational leadership includes building and developing teams, whether through direct management or influential leadership. You attract talent, develop careers, and create environments where analysts do their best work.
Executive partnership involves working as a peer with product, engineering, and business leadership. You represent analytics in strategic discussions, translate analytical capabilities into business terms, and advocate for data-driven decision-making at the highest levels.
Technical depth with breadth means maintaining expertise while understanding the broader analytical landscape. You evaluate emerging tools and techniques, make build-vs-buy decisions, and ensure the analytical foundation scales with company needs.
Business acumen connects analytical work to business outcomes. You understand unit economics, growth models, and strategic priorities well enough to align analytical investments with business value.
Responsibilities at This Level
As a director or principal, you will set analytical strategy for product analytics across the organization. This includes prioritizing investments, establishing standards, and ensuring alignment with product and business strategy.
Build and lead teams through hiring, development, and performance management. You create career paths, establish team culture, and ensure analytical capabilities meet organizational needs.
Partner with executives to shape product strategy and organizational decisions. You provide analytical perspective on strategic questions and ensure leadership has the data insights they need.
Drive analytical transformation by improving capabilities, adopting new methodologies, and building the infrastructure that supports world-class product analytics.
Represent the company externally through conference talks, blog posts, and community engagement. Senior analytics leaders often build external reputation that aids recruiting and establishes thought leadership.
Titles at This Level
- Director of Product Analytics
- Principal Product Analyst
- Head of Product Analytics
- VP of Product Analytics
- Director of Data Science, Product
- Senior Principal Analyst
Analytics Tools and Platforms Comparison
Choosing the right tools and developing platform expertise significantly impacts your career opportunities and day-to-day effectiveness. Each major analytics platform has distinct strengths and market positioning.
Product Analytics Platform Comparison
Source: RoamJobs 2026 Product Analytics Survey| Platform | Learning Curve | Job Market | Best For | Key Strength |
|---|---|---|---|---|
| Amplitude | Moderate | Very High | Product-led growth, SaaS | Behavioral cohorts, retention |
| Mixpanel | Moderate | High | Mobile apps, startups | Event analytics, funnels |
| Heap | Easy | Medium-High | E-commerce, retroactive analysis | Auto-capture, session replay |
| Google Analytics 4 | Moderate-Hard | High | Marketing, web analytics | Free tier, Google integration |
| PostHog | Moderate | Growing | Open source, dev tools | Session recording, feature flags |
| Pendo | Easy-Moderate | Medium | B2B SaaS, in-app guidance | User feedback, guides |
Data compiled from RoamJobs 2026 Product Analytics Survey. Last verified January 2026.
Amplitude
Amplitude has emerged as the leading product analytics platform for growth-focused companies. Its strength lies in behavioral cohort analysis, retention modeling, and experimentation integration. Companies like Dropbox, Peloton, and Calm use Amplitude to understand user behavior and optimize product experiences.
Amplitude’s job market presence is strong and growing. Proficiency with Amplitude is increasingly required or preferred in job postings, especially at SaaS and product-led growth companies. The platform offers excellent documentation, certifications, and a community that supports skill development.
For career purposes, Amplitude expertise translates well to other platforms since its concepts (events, properties, cohorts) are foundational to product analytics. Learning Amplitude deeply serves as a strong foundation regardless of what tools you use later.
Mixpanel
Mixpanel pioneered event-based product analytics and remains popular, particularly for mobile apps and startups. Its strength is intuitive funnel analysis and event tracking, with a user interface that product managers often find accessible without analyst support.
The job market for Mixpanel skills is solid, especially at mobile-focused companies and startups that adopted it early. Mixpanel has modernized significantly, adding features like group analytics and data management that make it suitable for larger organizations.
Mixpanel and Amplitude have significant overlap, so expertise in one transfers well to the other. If you are choosing between them, consider which platform is more common at your target companies.
Heap
Heap differentiates through automatic event capture. Rather than requiring explicit tracking implementation, Heap captures all user interactions automatically and allows retroactive analysis. This approach appeals to companies that want insights quickly without extensive engineering work.
Heap’s job market is smaller than Amplitude or Mixpanel but growing, especially for e-commerce and companies that value quick implementation. Its session replay and heatmap capabilities position it at the intersection of product analytics and user research.
The auto-capture approach has tradeoffs. While it enables faster time-to-insight, the data can be messier than explicit tracking. Understanding these tradeoffs demonstrates sophisticated analytical thinking.
Google Analytics 4
Google Analytics 4 (GA4) represents Google’s event-based analytics platform, replacing Universal Analytics. Its primary strength is the free tier and integration with Google’s advertising ecosystem. GA4 is common for web analytics and marketing-focused measurement.
GA4 skills remain valuable, but the platform is often used alongside product analytics tools rather than replacing them. Companies frequently use GA4 for marketing attribution and acquisition analysis while using Amplitude or Mixpanel for in-product behavior.
For career purposes, GA4 proficiency is broadly useful but does not differentiate you for product analytics roles as much as Amplitude or Mixpanel expertise.
Experimentation Platform Comparison
Source: RoamJobs 2026 Experimentation Survey| Platform | Learning Curve | Job Market | Best For | Statistical Approach |
|---|---|---|---|---|
| Statsig | Moderate | Growing | Feature flags + experimentation | Sequential testing |
| Optimizely | Moderate | High | Web experimentation, enterprise | Frequentist + Bayesian |
| LaunchDarkly | Easy-Moderate | High | Feature management | Flag-based rollouts |
| Eppo | Moderate-Hard | Growing | Warehouse-native experiments | Advanced statistics |
| Split | Moderate | Medium | Enterprise feature flags | Progressive delivery |
| GrowthBook | Moderate | Growing | Open source, startups | Bayesian, warehouse-native |
Data compiled from RoamJobs 2026 Experimentation Survey. Last verified January 2026.
Experimentation Platforms
Experimentation capability separates product analysts from general data analysts. Understanding A/B testing platforms and their statistical methodologies is essential for remote product analyst roles.
Statsig has grown rapidly by combining feature flags with statistical rigor. Its sequential testing approach allows faster experiment decisions while maintaining statistical validity. Many tech companies have adopted Statsig for its balance of ease-of-use and analytical sophistication.
Optimizely remains the enterprise standard for web experimentation, with strong capabilities for content optimization and personalization. Its statistical engine is well-documented and trusted by large organizations.
Eppo represents the emerging warehouse-native approach to experimentation. Rather than duplicating data, Eppo runs experiments against your existing data warehouse. This approach appeals to companies with mature data infrastructure and analysts who want control over statistical methodology.
GrowthBook offers open-source experimentation with Bayesian statistics, popular at startups and companies that value transparency and customization.
SQL and Data Infrastructure Skills
SQL proficiency is non-negotiable for product analysts at all levels. Beyond basic queries, you should understand:
Window functions for calculating metrics like running totals, rankings, and period-over-period comparisons. These are essential for retention analysis, funnel conversion, and metric trending.
CTEs and subqueries for organizing complex analytical queries into readable, maintainable code. Your SQL should be understandable to teammates who review your work.
Performance optimization including indexing, query planning, and efficient joins. Working with large datasets requires queries that run in reasonable time.
Data warehouse knowledge of platforms like BigQuery, Snowflake, Redshift, or Databricks. Understanding your company’s data infrastructure helps you work effectively with data engineers and optimize your analytical workflows.
Python and Statistical Tools
While SQL handles most product analytics work, Python proficiency adds valuable capabilities.
pandas and numpy for data manipulation when SQL is insufficient or when you need to combine data sources outside your warehouse.
scipy and statsmodels for statistical analysis including significance testing, regression, and experimentation analysis that goes beyond platform defaults.
Visualization libraries like matplotlib, seaborn, or plotly for creating custom visualizations that dashboarding tools cannot produce.
Jupyter notebooks for reproducible analysis that documents your methodology and findings in shareable formats.
Python skills become more important at senior levels where you tackle complex statistical problems and build custom analytical tools.
Data Visualization Skills
Creating effective visualizations distinguishes impactful analysts from those who simply produce numbers. You should be proficient in at least one of the major visualization platforms:
Looker dominates enterprise analytics with its semantic modeling layer (LookML) and tight BigQuery integration. Looker skills are highly valued at larger companies.
Tableau remains the most widely used visualization tool with excellent interactivity and broad data connectivity. Tableau Public offers free practice and portfolio hosting.
Metabase is popular at startups for its simplicity and open-source option. Understanding Metabase demonstrates ability to work in lean analytics environments.
Mode Analytics combines SQL notebooks with visualization, popular with data teams that value code-first workflows.
Companies Hiring Remote Product Analysts
The remote product analyst job market spans from early-stage startups to public companies. Understanding which companies hire remotely and their analytical cultures helps you target your search effectively.
Remote-First Product Analytics Teams
Amplitude practices what they preach with a fully distributed team building product analytics tools. Product analyst positions focus on understanding how customers use Amplitude itself and optimizing the product experience. Working at an analytics company provides exceptional learning opportunities.
GitLab maintains exceptional analytics documentation as part of their handbook-first culture. Product analysts work embedded in product teams across their DevOps platform. GitLab’s transparency about their practices helps you assess cultural fit before applying.
Automattic (WordPress.com, WooCommerce, Tumblr) operates fully distributed with strong emphasis on async communication. Product analysts work on products used by millions with significant data scale challenges.
Zapier employs product analysts to understand how users build automations and optimize the platform experience. Strong data-driven culture with emphasis on experimentation and growth analytics.
Buffer is known for transparent culture and small but impactful analytics team. Product analysts work closely with product and engineering in a highly collaborative environment.
Doist (Todoist, Twist) builds productivity tools with analytics teams focused on user engagement and retention. Smaller team size means high ownership and broad scope.
Notion has grown its remote analytics presence significantly. Product analysts work on understanding how users adopt features and build workflows within the flexible workspace product.
Data-Driven Product Companies
Spotify combines music streaming with sophisticated product analytics and experimentation. Product analysts work on personalization, discovery, and engagement challenges with massive scale. Remote positions available in many regions.
Airbnb pioneered many product analytics practices and continues to invest heavily in experimentation infrastructure. Product analysts work on marketplace dynamics, pricing, and user experience optimization.
DoorDash applies analytics to logistics and marketplace challenges. Product analysts work on driver efficiency, customer retention, and merchant optimization with real-world operational complexity.
Stripe builds financial infrastructure requiring rigorous analytics on user behavior, fraud detection, and product adoption. Product analyst roles combine financial domain knowledge with product thinking.
Coinbase applies product analytics to cryptocurrency trading and financial products. Product analysts work on user acquisition, engagement, and compliance in a rapidly evolving regulatory environment.
Shopify went “digital by default” and hires product analysts across their e-commerce platform. Analysts work on merchant success, checkout optimization, and platform features serving millions of stores.
HubSpot offers “@flex” work arrangements with strong analytics culture. Product analysts focus on CRM feature adoption, user onboarding, and growth metrics.
Growing Startups with Remote Analytics Teams
Figma builds collaborative design tools with growing analytics presence. Product analysts work on understanding creative workflows and collaboration patterns.
Linear maintains a small team building exceptional issue tracking software. Analytics roles focus on product-led growth and self-serve adoption.
Vercel (creators of Next.js) hires product analysts to understand developer workflows and platform adoption. Technical context helpful for understanding developer tool usage.
PostHog builds open-source product analytics and hires analysts to understand their own product usage. Working at an analytics company provides unique meta-learning opportunities.
Cal.com is an open-source scheduling platform with distributed team. Product analysts work on booking flows and user engagement.
Supabase offers Firebase alternative with remote-first culture. Product analysts understand developer adoption and database usage patterns.
How to Find Unlisted Opportunities
Many product analyst positions fill before public posting. To access the hidden job market:
Engage with analytics content and communities. Follow analytics leaders on LinkedIn and Twitter, participate in communities like Locally Optimistic or dbt Community, and engage thoughtfully with content from target companies.
Build relationships with product managers. PMs often have significant influence over analyst hiring. Building relationships through networking or open source contributions can surface opportunities.
Monitor company blogs and announcements. Companies often signal hiring needs through blog posts about new products, metrics improvements, or team growth. Reaching out proactively can catch them before formal job postings.
Attend virtual analytics events. Conferences like Amplitude Amplify, Looker JOIN, or local analytics meetups provide networking opportunities and visibility into which companies are building analytics capabilities.
Leverage LinkedIn strategically. Connect with hiring managers and recruiters at target companies. When positions open, you will be on their radar if they have seen your relevant content and engagement.
Interview Deep Dive
Product analyst interviews evaluate technical skills, analytical thinking, product sense, and communication ability. Preparing across all dimensions significantly improves your success rate.
SQL and Technical Questions
This common product analytics SQL question tests window functions and retention concepts.
Key approach:
- First, identify each user’s first activity date (signup or first event)
- For each subsequent day, determine if users were active exactly 7 days after their first activity
- Calculate the retention rate as users active on day 7 divided by total users who started on each cohort date
Query structure:
WITH user_cohorts AS (
  SELECT
    user_id,
    MIN(activity_date) AS cohort_date
  FROM user_activity
  GROUP BY user_id
),
retention_activity AS (
  SELECT
    c.cohort_date,
    c.user_id,
    CASE WHEN a.activity_date IS NOT NULL THEN 1 ELSE 0 END AS retained_day_7
  FROM user_cohorts c
  LEFT JOIN user_activity a
    ON c.user_id = a.user_id
    AND a.activity_date = DATE_ADD(c.cohort_date, INTERVAL 7 DAY)
)
SELECT
  cohort_date,
  COUNT(DISTINCT user_id) AS cohort_size,
  SUM(retained_day_7) AS retained_users,
  ROUND(SUM(retained_day_7) * 100.0 / COUNT(DISTINCT user_id), 2) AS retention_rate
FROM retention_activity
GROUP BY cohort_date
ORDER BY cohort_date;
Discussion points to demonstrate:
- Clarify whether “retention” means any activity or specific actions
- Discuss rolling vs. cohort-based retention approaches
- Explain tradeoffs of different date handling approaches
- Consider how to handle users with multiple activities on day 7
This question tests your systematic approach to investigating metric changes, a core product analyst skill.
Structured investigation approach:
-
Validate the data first
- Check for data quality issues, logging changes, or tracking problems
- Verify the metric calculation hasn’t changed
- Look for any known technical issues during the period
-
Decompose the metric
- Break down by user segments (geography, acquisition source, plan type, device)
- Check if the drop is concentrated in specific segments or broad-based
- Analyze funnel stages to identify where drop-off increased
-
Consider external factors
- Product changes or experiments launched during this period
- Pricing or plan changes
- Seasonality or calendar effects
- Marketing campaign changes affecting user quality
-
Analyze behavioral patterns
- Compare user behavior between converters and non-converters
- Look for changes in trial engagement metrics
- Check if trial start volume or quality changed
-
Form hypotheses and prioritize
- Based on analysis, develop specific hypotheses
- Prioritize by likelihood and potential impact
- Recommend next steps for validation
Key demonstration points:
- Show systematic rather than random investigation
- Start with data quality before assuming real change
- Use decomposition to narrow down causes
- Communicate findings and next steps clearly
This question assesses your understanding of experiment design and stakeholder collaboration.
Key questions to ask:
-
Business context
- What is the hypothesis? What improvement do we expect?
- What is the minimum detectable effect that would be business-meaningful?
- Are there any constraints (timeline, traffic, technical)?
-
Metric selection
- What is the primary success metric? (e.g., checkout completion rate)
- What are guardrail metrics we should not harm? (e.g., revenue per user, returns)
- Are there leading indicators we should track?
-
Population and targeting
- Who should be included in the experiment?
- Are there segments we should exclude? (e.g., existing customers, specific regions)
- Should we consider stratified randomization?
-
Statistical considerations
- What is the baseline conversion rate?
- How much traffic is available?
- What significance level and power are required?
- How long will we need to run for sufficient sample size?
-
Operational questions
- How will users be randomized?
- Is this a user-level or session-level experiment?
- What is the rollout plan if the test succeeds?
- How will we handle edge cases (returning users, multiple devices)?
Sample size calculation demonstration:
- Show understanding of relationship between MDE, baseline rate, power, and sample size
- Discuss tradeoffs between running longer for smaller effects vs. shipping faster
- Consider when sequential testing might be appropriate
This question tests your ability to communicate technical concepts clearly, essential for product analysts who influence decisions.
Clear explanation approach:
Statistical significance tells us how confident we can be that the difference we see in our experiment is real, not just random chance.
Imagine flipping a coin 10 times. If you get 6 heads, that does not prove the coin is unfair because you might get 6 heads with a fair coin just by luck. But if you flip 1000 times and get 600 heads, something is probably wrong with the coin.
In A/B testing, we are asking a similar question: is the difference we see between versions A and B large enough, given our sample size, that we can be confident it is not just random variation?
When we say a result is “statistically significant at 95% confidence,” we mean there is only a 5% chance we would see a difference this large if both versions were actually the same. It is like saying “I am 95% confident this difference is real.”
Important caveats to mention:
- Statistical significance does not mean the difference is large or important, just that it is likely real
- We need to decide what size difference matters to the business separately
- More users in our test gives us more confidence in smaller differences
- We set our significance threshold before running the test to avoid cherry-picking results
Key demonstration points:
- Use concrete analogies (coin flips, not mathematical formulas)
- Anticipate follow-up questions about practical implications
- Show understanding of common misinterpretations
- Balance accuracy with accessibility
This question tests your statistical fundamentals for experiment design.
Calculation approach:
For a two-proportion z-test:
- Baseline conversion rate (p1) = 10% = 0.10
- Expected treatment conversion rate (p2) = 10% * 1.10 = 11% = 0.11
- Absolute difference (d) = 0.11 - 0.10 = 0.01
- Alpha (significance level) = 0.05, so Z_alpha/2 = 1.96
- Beta (1 - power) = 0.20, so Z_beta = 0.84
Formula: n = 2 * [(Z_alpha/2 + Z_beta)^2 * p * (1-p)] / d^2
Where p is the pooled proportion = (p1 + p2) / 2 = 0.105
n = 2 * [(1.96 + 0.84)^2 * 0.105 * 0.895] / 0.01^2 n = 2 * [7.84 * 0.094] / 0.0001 n = 2 * 737.0 / 0.0001 n = approximately 14,740 per group
Total sample size: approximately 29,480 users across both groups
Discussion points:
- This is per group, so double for total experiment size
- With 10% baseline and 10% relative lift, we need meaningful traffic
- If traffic is limited, options include accepting lower power, longer runtime, or larger MDE
- Sequential testing could potentially reach conclusions faster
- Consider whether the 10% relative improvement is the right threshold
Practical considerations to mention:
- Runtime calculation: daily eligible users / total needed = days to run
- Account for multiple comparisons if testing multiple variants
- Consider stratification if traffic has known heterogeneity
This question tests your ability to think holistically about product measurement.
HEART Framework application:
Happiness (Satisfaction)
- User ratings of recommended content (thumbs up/down, stars)
- Survey responses about recommendation quality
- Qualitative feedback themes from user research
Engagement
- Click-through rate on recommendations
- Time spent on recommended content vs. organic discovery
- Repeat engagement with recommendations over time
- Share/save rate of recommended items
Adoption
- Percentage of users who interact with recommendations
- Time to first recommendation click after feature exposure
- Feature discovery rate for new users
Retention
- Return rate of users who engaged with recommendations
- Correlation between recommendation usage and overall retention
- Recommendation-driven sessions over time
Task Success
- Completion rate of discovering relevant content
- Time to find content of interest
- Reduced search/browse effort for active recommendation users
Primary metric selection:
For this feature, I would recommend recommendation click-through rate as the primary metric because it directly measures whether recommendations are surfacing relevant content that users want to engage with.
Guardrail metrics:
- Overall session length (ensure recommendations do not reduce other engagement)
- Non-recommended content engagement (ensure we are adding value, not just shifting behavior)
- Unsubscribe/opt-out rate (ensure recommendations are not annoying users)
Leading indicators:
- Recommendation impressions (feature is being shown)
- Diversity of content clicked (recommendations are not one-dimensional)
- Second-click rate (users find value beyond initial click)
Success criteria:
- X% improvement in click-through rate over baseline
- No degradation in guardrail metrics
- Positive qualitative feedback in user research
This question tests your judgment in ambiguous situations and stakeholder management skills.
Analytical perspective:
With p-value of 0.08, there is an 8% probability we would see this result if there was actually no difference. This does not meet the conventional 95% significance threshold (p < 0.05).
However, this is not a binary “ship or don’t ship” decision. Consider:
Factors favoring shipping:
- 5% improvement is meaningful if sustained
- p-value of 0.08 still suggests 92% likelihood the effect is real
- Cost of delay (opportunity cost, market timing)
- Low downside risk if the treatment is neutral
- Can implement as holdout experiment to continue monitoring
Factors favoring caution:
- We set significance threshold before the test for good reason
- False positives accumulate across many decisions
- The true effect might be smaller or zero
- If this feature has high implementation/maintenance cost
- If getting it wrong has significant negative consequences
My recommendation approach:
-
Understand the stakes. If this is a low-risk change with meaningful upside, shipping with monitoring makes sense. If it is high-cost or hard to reverse, I would recommend extending the test.
-
Calculate what we would learn from more data. How many more days/users to reach significance if the effect is real?
-
Propose a middle path. Consider shipping with a holdout group to continue measuring, or implement for a subset of users.
-
Document the decision and rationale. Whatever we decide, record the statistical context so we learn from this decision over time.
Communication: “The results are promising but not conclusive. Here are the options and tradeoffs. I recommend [specific action] because [specific reasoning]. What constraints or context should I factor into this recommendation?”
This question tests your ability to manage stakeholders and prioritize effectively.
Prioritization framework:
1. Understand the requests:
- What decision does each analysis support?
- What is the timeline and urgency?
- What is the scope and effort required?
- What is the business impact of the decision?
2. Establish transparent criteria:
- Impact: What decisions will this enable? How large is the user/revenue impact?
- Urgency: What is the cost of delay? Are there external deadlines?
- Effort: How much analytical work is required?
- Alignment: How does this connect to company priorities?
3. Create visibility:
- Maintain a transparent queue of requests
- Share prioritization criteria so PMs understand the framework
- Provide realistic timelines based on current workload
4. Communicate tradeoffs:
- When taking on new work, communicate what gets delayed
- Enable PMs to advocate for their priorities with context
- Escalate when demand exceeds capacity
5. Identify efficiency opportunities:
- Are there self-serve dashboards that could answer some questions?
- Can requests be combined or scoped down?
- Are there recurring needs that should be automated?
Example response to a PM: “I understand this is important for your feature launch. Here’s where it fits in my current queue based on impact and urgency. If you need this faster, we have a few options: we could scope it down to answer the core question faster, I could share a self-serve approach you could try, or we could discuss with [manager/other PM] whether priorities should shift. What works best for you?”
Key demonstration points:
- Show respect for all stakeholders’ needs
- Use clear criteria rather than arbitrary decisions
- Communicate proactively rather than disappearing
- Enable escalation when needed without creating conflict
This question tests your causal inference skills when randomized experiments are not possible.
Analytical approach:
Without randomization, we need quasi-experimental methods to estimate causal impact while acknowledging limitations.
1. Define the comparison framework:
- Pre/post comparison: Compare metrics before and after launch
- Interrupted time series: Model pre-launch trend and measure deviation
- Synthetic control: If available, use comparable products/regions not exposed
- Natural experiment: Look for variation in exposure (staggered rollout, technical issues)
2. Gather relevant data:
- Metrics for 8-12 weeks pre-launch to establish baseline and seasonality
- Post-launch metrics with sufficient time for effects to stabilize
- Any technical issues or partial exposures that create variation
- External factors that might affect metrics during this period
3. Address confounds:
- What else changed during this period? (Marketing, seasonality, competitors)
- Did user composition change? (Different users pre vs. post)
- Were there technical issues that affected metrics?
- How do we separate redesign impact from general trend?
4. Analysis methods:
Difference-in-differences (if control group exists): If the redesign was mobile-only or certain regions, compare the change in metrics for exposed group vs. unexposed group.
Interrupted time series: Model pre-launch trend (including seasonality), project what would have happened without launch, measure difference from actual results. Account for autocorrelation.
Regression with controls: Include control variables for known confounds (marketing spend, day-of-week, etc.) to isolate redesign effect.
5. Quantify uncertainty:
- These methods have more uncertainty than proper A/B tests
- Provide confidence intervals and discuss limitations
- Be explicit about assumptions and what could invalidate conclusions
6. Recommendations:
- Present findings with appropriate caveats
- Recommend setting up proper measurement for future launches
- Suggest ongoing monitoring and potential holdout experiments
Key demonstration points:
- Show familiarity with causal inference methods
- Acknowledge limitations honestly
- Propose practical approaches given constraints
- Focus on actionable insights despite imperfect data
This question tests your stakeholder management and communication skills in difficult situations.
Communication approach:
1. Prepare thoroughly before the conversation:
- Verify the analysis multiple times, check for errors
- Explore alternative explanations and edge cases
- Identify any positive findings or learnings
- Prepare concrete recommendations for next steps
2. Lead with empathy and collaboration:
- Acknowledge the team’s effort and investment
- Frame as joint problem-solving, not delivering a verdict
- Focus on what we learn, not who was wrong
3. Present findings clearly and honestly:
- Share the data and methodology transparently
- Acknowledge uncertainty and limitations
- Do not hide or soften the core finding, but present constructively
4. Provide context and nuance:
- Are there segments where it did work?
- Were there implementation issues that might have affected results?
- What hypotheses might explain the results?
- Is more time or data needed to draw conclusions?
5. Focus on forward-looking actions:
- What did we learn that informs future work?
- Are there modifications that might improve results?
- How do we apply these learnings to other initiatives?
- What should we measure differently next time?
Example communication:
“I wanted to share the analysis of Feature X with you before the broader review. The data shows that the feature isn’t moving our target metric the way we hoped. I’ve triple-checked the analysis and explored several alternative hypotheses.
Before I walk through the details, I want to acknowledge the significant work you and the team put into this. Understanding what didn’t work is just as valuable as what does work for making better decisions going forward.
Here’s what I found… [present data]
There are a few potential explanations worth discussing… [hypotheses]
Based on this, I’d recommend… [next steps]
I want to discuss this with you first to make sure I’m not missing anything and to figure out how we present this to the broader team. What questions do you have?”
Key demonstration points:
- Show respect for stakeholders while maintaining analytical integrity
- Balance empathy with honesty
- Focus on learning and improvement, not blame
- Collaborate on how to communicate and act on findings
This question tests your ability to explain fundamental concepts that inform product decisions.
Clear explanation:
Correlation means two things tend to happen together. Causation means one thing actually causes the other.
Example: We might observe that users who engage with our recommendation feature have 30% higher retention than users who do not. This is a correlation, and it could mean:
-
Causation: Using recommendations genuinely causes users to be more retained because they discover valuable content.
-
Reverse causation: Users who are already more engaged and likely to be retained are also more likely to explore and use recommendations.
-
Common cause: Something else (like user expertise or use case) causes both recommendation usage AND higher retention separately.
Why this matters in product analytics:
If we assume causation when we only have correlation, we make bad decisions:
- If we think recommendations cause retention, we might invest heavily in making everyone use recommendations
- But if the correlation is driven by user type, forcing recommendations on casual users might actually annoy them and hurt retention
- The correct approach is to run an A/B test where we randomly enable recommendations for some users, which isolates the causal effect
How to establish causation:
-
Randomized experiments (A/B tests) are the gold standard because randomization breaks the link between treatment and confounding factors
-
Natural experiments where something changed for some users but not others for reasons unrelated to user characteristics
-
Causal inference methods (regression discontinuity, instrumental variables, etc.) when experiments are not possible, though these have more assumptions
Key demonstration points:
- Use concrete product examples, not abstract statistics
- Explain why this distinction matters for decision-making
- Show how to address the problem (experimentation)
- Acknowledge when we cannot establish causation and what to do
This question tests your ability to think about complex product measurement scenarios.
Measurement approach:
Cannibalization occurs when a new product takes revenue or engagement from an existing product rather than generating incremental value. Measuring this requires understanding both direct substitution and overall impact.
Framework:
-
Define the hypothesis clearly:
- What specific behavior constitutes cannibalization?
- Are we measuring revenue, engagement, or user count?
- What is the counterfactual (what would happen without new product)?
-
Establish baseline metrics:
- Existing product metrics pre-launch (engagement, revenue, retention)
- User segments most likely to adopt new product
- Historical trends and seasonality
-
Experimental design (ideal):
- If possible, launch new product to randomized subset of users
- Compare existing product metrics for exposed vs. unexposed users
- This isolates cannibalization from other factors
-
Observational analysis (if experiment not possible):
- Track users who adopt new product vs. those who do not
- Compare existing product usage pre and post adoption
- Control for user characteristics that predict both adoption and usage
- Use propensity score matching or similar methods
-
Key metrics to track:
- Total revenue/engagement across both products (net impact)
- Cross-product user behavior (do users use both or switch?)
- Segment-level analysis (which users are most affected?)
- Time-series analysis (does cannibalization stabilize?)
-
Calculating net impact:
- New product revenue/engagement
- Minus: lost existing product revenue/engagement
- Plus: any complementary effects (users who do more overall)
- Equals: true incremental value
Example analysis:
“Among users who adopted the new product, we see a 20% decrease in existing product usage. However, their total cross-product engagement increased by 15%, and they have 10% higher retention. New product users also generate higher total revenue despite the shift. This suggests positive net impact despite some cannibalization.”
Communication considerations:
- Frame cannibalization in context of strategic goals
- Is cannibalization acceptable if it blocks competitors or serves unmet needs?
- Present both gross and net impact clearly
This question tests your ability to influence decisions with data and handle stakeholder dynamics.
Strong answer structure (STAR method):
Situation: Set the context briefly
- What was the business situation?
- What decision was being considered?
- What did stakeholders initially believe?
Task: Explain your role
- What analysis were you asked to do?
- What was the scope of your responsibility?
Action: Detail your approach
- How did you conduct the analysis?
- How did you present findings that contradicted expectations?
- How did you handle pushback or skepticism?
Result: Share outcomes
- What decision was ultimately made?
- What was the impact?
- What did you learn?
Example answer:
“The product team wanted to expand a premium feature to all users based on high engagement among premium subscribers. They assumed broader access would drive conversions.
I analyzed feature usage patterns and found that engagement was driven by a specific workflow that primarily appealed to advanced users. When I modeled the likely behavior of free users, I projected low adoption and potential confusion that could hurt onboarding metrics.
I presented my findings to the PM with clear data visualization showing the user segment differences. Rather than just saying ‘don’t do this,’ I proposed an alternative: a simplified version of the feature tailored to the free user workflow.
The PM was initially skeptical but appreciated the concrete data. We ran a small test of my alternative approach, which showed 3x higher adoption among free users than the original plan projected.
The key lesson was presenting alternatives rather than just objections, and grounding recommendations in specific user evidence.”
Key demonstration points:
- Show analytical rigor in your approach
- Demonstrate constructive communication of difficult findings
- Illustrate collaborative problem-solving
- Quantify the impact of your influence
This question tests your ability to prioritize measurement and think holistically about product health.
Framework for selection:
The three metrics should cover different dimensions of product health while being actionable and measurable.
My recommended framework:
1. Activation metric (leading indicator)
- Measures if users reach the “aha moment” where they experience core value
- Example: Percentage of new users who complete key onboarding action within first session
- Why: Predicts long-term success and is immediately actionable for optimization
2. Engagement metric (ongoing value)
- Measures if users continue finding value over time
- Example: Weekly active users performing core action, or DAU/MAU ratio
- Why: Shows product-market fit and forms foundation for retention and monetization
3. Retention metric (sustainability)
- Measures if users come back over time
- Example: Week 4 or Day 30 retention rate
- Why: Compound effect drives growth; proves lasting value beyond initial novelty
Reasoning for what to exclude:
- Revenue: Important but lagging; if activation, engagement, and retention are healthy, revenue follows
- Acquisition: Important but often outside product team control; focus product metrics on what you can directly influence
- NPS/satisfaction: Valuable but subjective and harder to act on than behavioral metrics
Context considerations:
For different product types, I would adjust:
- Marketplace: Would add liquidity metrics (e.g., transaction rate)
- Subscription: Would weight retention more heavily
- Viral product: Would add referral/invite metrics
- B2B: Would consider account-level metrics alongside user metrics
How I would use these three metrics:
- Daily/weekly monitoring for trend changes
- Segmentation to identify where to focus improvement efforts
- Goal-setting for product initiatives
- Leading indicators for forecasting business outcomes
This question tests your integrity, communication skills, and approach to sensitive situations.
Approach:
1. Verify thoroughly first:
- Double-check your findings before raising alarm
- Understand the scope and severity of the issue
- Identify how long the issue has existed and who might be affected
2. Understand the root cause:
- Is this a logging error, calculation error, or definition change?
- Was it caused by a recent change or longstanding issue?
- What is needed to fix it?
3. Assess impact:
- What decisions were made based on this data?
- How materially affected are those decisions?
- Who needs to know about this?
4. Communicate promptly and appropriately:
- Raise to direct manager and relevant stakeholders quickly
- Present facts clearly without blame
- Come with proposed solutions or next steps
5. Help with remediation:
- Support fixing the root cause
- Help restate historical metrics if needed
- Update any dashboards or reports affected
Example response:
“When I discovered a significant discrepancy in our revenue tracking, I first spent a day verifying the issue and understanding its scope. I found that a logging change three weeks prior had caused certain transactions to be double-counted, inflating reported revenue by approximately 8%.
I immediately scheduled time with my manager and the data engineering lead to present my findings. I prepared a clear summary: the issue, how I discovered it, the impact scope, and a proposed fix.
We decided to correct the historical data and notify relevant stakeholders, including finance and the executive team who had received the inflated numbers. I helped prepare the communication and updated all affected dashboards.
It was uncomfortable to surface an error that had gone into important reports, but the alternative of not flagging it would have been worse. The experience led us to implement better data validation checks going forward.”
Key demonstration points:
- Show integrity by raising issues even when uncomfortable
- Demonstrate systematic verification before escalating
- Illustrate constructive problem-solving approach
- Balance urgency with thoroughness
What Hiring Managers Look For
Beyond technical skills, remote product analyst hiring managers evaluate several qualities specific to distributed work and product partnership.
Analytical rigor with practical judgment tops the list. Can you design sound analyses and also know when “good enough” is appropriate? Managers look for analysts who balance statistical perfectionism with business pragmatism.
Clear communication matters enormously. Your writing during the interview process is evaluated. Are your explanations structured? Can you translate complex findings into actionable recommendations? Remote analysts must communicate through documents, not just live explanations.
Product sense distinguishes product analysts from generic data analysts. Do you understand what makes products successful? Can you anticipate what questions will matter before being asked? This demonstrates you will be a thought partner, not just a query machine.
Self-direction and proactive ownership matter because remote managers cannot see you working. They look for evidence that you identify analytical opportunities independently and communicate proactively about your work.
Stakeholder management skills predict success in cross-functional product teams. Can you balance multiple priorities, push back appropriately, and build trust with PMs and engineers?
Frequently Asked Questions
Frequently Asked Questions
What is the difference between a product analyst and a data analyst?
Product analysts specialize in understanding user behavior and product performance, working primarily with product teams on metrics, experimentation, and user insights. Data analysts work across broader business functions including marketing, operations, finance, and customer support. Product analysts typically need deeper product context and experimentation expertise, while data analysts may have broader reporting responsibilities. The boundaries vary by company. Some organizations use the titles interchangeably, while others have distinct teams. Product analyst roles are generally more competitive and specialized, often with higher compensation at equivalent levels. If you want to focus on product strategy and user behavior rather than business reporting, target product analyst specifically.
Can I become a product analyst without a statistics or math degree?
Yes, many successful product analysts come from non-quantitative backgrounds. What matters is demonstrated analytical ability and statistical knowledge, not the credential. You need to understand hypothesis testing, confidence intervals, sample size calculations, and experimental design. You can learn these through online courses (Coursera statistics specializations, Khan Academy), books (Naked Statistics, Trustworthy Online Controlled Experiments), or bootcamps. More importantly, you need hands-on experience applying statistics to real problems. Build portfolio projects that demonstrate statistical analysis, contribute to A/B testing at your current job, or find volunteer analytics opportunities. The practical application matters more than academic background. That said, statistics courses definitely help build the foundation efficiently.
How much SQL do I really need to know for product analyst roles?
SQL is the most critical technical skill for product analysts. You need to be proficient enough to answer complex business questions independently, which means mastering: JOINs (inner, left, right, and understanding when to use each), aggregations and GROUP BY, window functions (for rankings, running totals, lag/lead comparisons), CTEs and subqueries for complex multi-step analysis, date handling and period-over-period calculations, and performance considerations for large tables. During interviews, you will likely face SQL questions ranging from medium to hard difficulty. The bar is high because most of your daily work involves querying data. Practice until you can write complex queries confidently without reference documentation. LeetCode, Mode Analytics tutorials, and StrataScratch offer product-relevant SQL practice. Aim for at least 100-150 practice problems before interviewing.
Is product analyst a good path to product management?
Product analyst is one of the most common and effective paths to product management. Working closely with PMs, you develop product sense, learn to prioritize based on impact, and understand the product development process. You also build credibility as someone who understands both data and product. The transition typically happens in one of three ways: internal transfer after demonstrating product judgment alongside analytical skills, applying externally with your PM-adjacent experience highlighted, or taking on increasingly PM-like responsibilities until the title follows. To optimize this path: volunteer for product-adjacent work (writing specs, leading projects), develop opinions about product strategy beyond just data insights, and communicate your PM interest to your manager. The analytical skills you build remain valuable as a PM and differentiate you from PMs who struggle with data.
What experimentation knowledge do I need for product analyst interviews?
Experimentation is a core competency for product analysts. You should understand: A/B test design including hypothesis formation, metric selection, and randomization, sample size calculations based on baseline rate, minimum detectable effect, power, and significance level, statistical significance interpretation and common misconceptions, multiple comparison problems and how to handle them, common pitfalls (novelty effects, peeking, Simpson's paradox), when to use different test types (A/B, multivariate, sequential), and how to communicate experiment results to non-technical stakeholders. Interviews often include questions about designing experiments, interpreting results, and handling edge cases. Read 'Trustworthy Online Controlled Experiments' (the Kohavi book) for comprehensive coverage. Practice explaining concepts simply. Many candidates can calculate sample sizes but struggle to explain why it matters.
Should I learn Python or R for product analytics?
Python is the recommended choice for most product analysts. It has broader industry adoption, better integration with data infrastructure (APIs, data pipelines, production systems), and more versatile applications beyond statistics. SQL handles most day-to-day product analytics work, with Python filling gaps for complex analysis, automation, and machine learning applications. Learn pandas for data manipulation, scipy/statsmodels for statistical analysis, and visualization libraries (matplotlib, seaborn, plotly). R remains valuable in research-oriented or statistically intensive environments, particularly companies with academic roots. If you are joining a team that uses R, learn R. But for general career optimization, Python plus SQL is the strongest combination. Junior analysts can succeed with SQL alone; Python becomes more important at mid and senior levels for complex analysis and automation.
How do remote product analyst interviews differ from in-person?
Remote product analyst interviews emphasize written communication more heavily. Your emails, case study documentation, and SQL query comments are evaluated alongside your verbal responses. Technical interviews use collaborative tools like Mode, BigQuery, or CoderPad for SQL, requiring comfort coding in browser environments. Case study presentations happen via video with screen sharing. The process typically includes more async components, like take-home analyses, since remote companies value async work skills. Prepare by practicing SQL in web-based environments (not just your local IDE), ensuring your home setup has professional video, audio, and reliable internet, preparing to explain your thinking verbally while coding, and practicing presenting analyses via screen share. Remote interviews can feel less personal, so be intentional about building rapport and showing enthusiasm through the screen.
What is the typical career progression for product analysts?
Product analyst careers typically progress through several levels: Associate/Junior (0-2 years) learning fundamentals and supporting analyses, Mid-level (2-5 years) owning analytical work for product areas independently, Senior (5-8 years) leading analytical strategy and mentoring others, and Director/Principal (8+ years) setting organizational analytics direction. From there, paths diverge: continue on the individual contributor track to Principal/Staff Analyst, move into people management as Analytics Manager/Director, transition to Product Management using analytical credibility, move toward Data Science for more advanced statistical work, or shift to Analytics Engineering focusing on data infrastructure. The highest-compensated paths are typically Analytics Director/VP (management) or Principal Analyst (IC leadership) at well-funded companies. Timeline varies by company size, performance, and opportunities. Proactive skill development and visibility accelerate advancement.
How important is domain expertise for product analyst roles?
Domain expertise matters more at senior levels and smaller companies. Entry and mid-level analysts can often transfer across domains because core analytical skills (SQL, statistics, experimentation) apply broadly. However, domain expertise provides advantages: faster ramp-up understanding product and metrics, more credibility with domain-expert PMs, and ability to anticipate important questions and patterns. High-value domains for product analytics include e-commerce (conversion, merchandising, pricing), marketplaces (two-sided dynamics, matching), SaaS (subscription, engagement, churn), fintech (risk, compliance, transactions), and consumer social (engagement, virality, content). You do not need domain expertise to get hired, but developing it accelerates impact and opens senior opportunities. If you are targeting a specific industry, researching its metrics and challenges before interviews demonstrates initiative.
Can I get a remote product analyst job without prior remote work experience?
Yes, many product analysts land remote roles without prior remote experience. What matters is demonstrating remote-ready skills: strong written communication (your application materials are evidence), self-direction and proactive communication, comfort with async collaboration tools, and ability to work independently while staying aligned with teams. In interviews, address remote readiness explicitly by discussing your workspace setup, how you manage time and priorities, and how you have collaborated with distributed colleagues (even in hybrid settings). Emphasize documentation habits and structured communication approaches. Remote-first companies have robust onboarding processes to integrate new remote employees. What differentiates candidates is not prior remote experience but demonstrated ability to communicate clearly, work independently, and collaborate effectively across distance. Your interview communication itself demonstrates these skills.
What makes a strong product analytics portfolio?
A strong product analytics portfolio demonstrates product thinking, not just SQL skills. Include 2-3 projects that show: clear product questions (not just generic data analysis), structured analytical approach, meaningful insights and recommendations, clean visualizations that communicate findings, and documentation of your methodology. Ideal projects include retention or cohort analysis for a product, funnel conversion analysis with segment breakdowns, experiment design and power analysis, metric framework for a hypothetical product, and user behavior clustering or segmentation. Use real datasets when possible (public datasets exist from companies like Instacart, Spotify, and many others). Document your thinking process extensively. Explain why you chose certain approaches, what alternatives you considered, and what you would do with more time or data. The analysis itself matters less than demonstrating how you think about product problems analytically.
How do I negotiate salary for a remote product analyst position?
Remote product analyst salary negotiation follows similar principles to other roles with some remote-specific considerations. Research market rates thoroughly using Levels.fyi, Glassdoor, and salary surveys. Understand whether the company uses location-based compensation or location-agnostic pay. Wait for the initial offer before discussing numbers. When asked early, deflect with wanting to learn more about the role. When you receive an offer, evaluate total compensation including base, equity, bonus, and benefits. Counter with a specific number justified by market data, your experience, or competing offers. Remote-specific negotiation points include home office stipend, equipment budget, coworking allowance, and travel budget for team meetups. Some companies have more flexibility on these perks than base salary. Be willing to walk away if the offer significantly undervalues you. Product analyst demand is strong, and undervaluing yourself sets a baseline that is hard to correct later.
Related Guides and Next Steps
Building a successful remote product analyst career requires developing both technical skills and remote work competencies. The following resources help you deepen your preparation.
Related Career Guides
If you are considering adjacent roles or want to understand the broader product landscape, explore these related guides:
Remote Product Jobs Hub provides an overview of all product specializations, helping you understand how product analytics fits into the broader product career landscape and potential transitions.
Remote Product Manager Jobs covers the PM role that product analysts frequently transition into. Understanding PM expectations helps you develop product sense alongside analytical skills.
Remote Data Analyst Jobs explores the broader data analyst role. If you are deciding between product analytics and general data analysis, this comparison helps clarify the differences and tradeoffs.
Skill Development Resources
For technical preparation, focus on these areas based on your current level:
SQL Mastery: Mode Analytics SQL tutorial (free, product-focused), StrataScratch for interview practice, and LeetCode Database problems provide structured practice. Aim for consistent daily practice rather than cramming.
Statistics and Experimentation: ‘Trustworthy Online Controlled Experiments’ by Kohavi et al. is the definitive reference. Complement with Coursera’s Statistical Inference course and Khan Academy statistics for fundamentals.
Analytics Platforms: Amplitude Academy and Mixpanel certifications provide structured learning on product analytics tools. Even if you use different tools, the concepts transfer.
Data Visualization: Storytelling with Data by Cole Nussbaumer Knaflic teaches effective communication. Practice in Tableau Public or Looker to build hands-on skills.
Building Your Application
When you are ready to apply, ensure you have:
- A strong resume highlighting product analytics experience, experimentation work, and quantified impact
- A portfolio with 2-3 product-focused analysis projects demonstrating your approach
- SQL proficiency demonstrated through practice and confidence in live coding
- Prepared examples of experiments you have designed or analyzed
- Research on target companies including their products, metrics, and analytical culture
Remote Product Analyst Job Search Checklist
- 1 Master SQL including window functions, CTEs, and complex joins
Practice until you can write complex queries confidently under time pressure
- 2 Learn at least one product analytics platform (Amplitude, Mixpanel, Heap)
Complete certifications and build portfolio projects using the platform
- 3 Understand A/B testing fundamentals: design, power analysis, interpretation
Read Trustworthy Online Controlled Experiments and practice sample size calculations
- 4 Build 2-3 product analytics portfolio projects
Focus on retention, funnels, or experimentation with real or realistic datasets
- 5 Develop data visualization skills in at least one tool
Tableau, Looker, or Metabase with focus on clear communication
- 6 Practice explaining statistical concepts in simple terms
Record yourself explaining significance, power, and experimental design
- 7 Research target companies and understand their products
Use their products, read their blogs, understand what they would want to measure
- 8 Prepare behavioral stories about stakeholder communication
Examples of presenting difficult findings, prioritizing requests, influencing decisions
- 9 Optimize LinkedIn with product analytics keywords
Highlight experimentation, metrics, SQL, and specific tools
- 10 Network in analytics communities
Engage in Locally Optimistic, dbt Community, and company-specific Slack groups
- 11 Practice SQL and case study interviews
Use StrataScratch, practice explaining approach while coding
- 12 Prepare your remote work setup
Professional video/audio, reliable internet, quiet workspace
The remote product analyst market offers exceptional opportunities for analytically-minded professionals who can combine statistical rigor with product intuition. Success requires consistent skill development, strategic job searching, and demonstrating both technical capability and effective remote collaboration.
Get Remote Product Analyst Job Alerts
Weekly curated remote product analyst positions, salary insights, and interview tips delivered to your inbox.
Frequently Asked Questions
How do I find remote product analyst.mdx jobs?
To find remote product analyst.mdx jobs, start with specialized job boards like We Work Remotely, Remote OK, and FlexJobs that focus on remote positions. Set up job alerts with keywords like "remote product analyst.mdx" and filter by fully remote positions. Network on LinkedIn by following remote-friendly companies and engaging with hiring managers. Many product analyst.mdx roles are posted on company career pages directly, so identify target companies known for remote work and check their openings regularly.
What skills do I need for remote product analyst.mdx positions?
Remote product analyst.mdx positions typically require the same technical skills as on-site roles, plus strong remote work competencies. Essential remote skills include excellent written communication, self-motivation, time management, and proficiency with collaboration tools like Slack, Zoom, and project management software. Demonstrating previous remote work experience or the ability to work independently is highly valued by employers hiring for remote product analyst.mdx roles.
What salary can I expect as a remote product analyst.mdx?
Remote product analyst.mdx salaries vary based on experience level, company size, location-based pay policies, and the specific tech stack or skills required. US-based remote positions typically pay market rates regardless of where you live, while some companies adjust pay based on your location's cost of living. Entry-level positions start lower, while senior roles can command premium salaries. Check our salary guides for specific ranges by experience level and geography.
Are remote product analyst.mdx jobs entry-level friendly?
Some remote product analyst.mdx jobs are entry-level friendly, though competition can be high. Focus on building a strong portfolio or demonstrable skills, contributing to open source projects if applicable, and gaining any relevant experience through internships, freelance work, or personal projects. Some companies specifically hire remote junior talent and provide mentorship programs. Smaller startups and agencies may be more open to entry-level remote hires than large corporations.
Continue Reading
Remote Product Jobs 2026: Complete Guide to PM, TPM & Leadership Careers
The definitive hub for remote product careers. Explore salary data, interview guides, and opportunities across product management, technical PM, product owner, and leadership roles.
18 min readRemote Data Analyst Jobs 2026: Analytics, BI & Data Science
Guide to remote data positions including technical skills, portfolio projects, and interviews.
14 min readRemote Product Manager Jobs: Complete 2026 Career Guide
Everything you need to land a remote product manager job. Strategy, roadmapping, stakeholder management - salary data, interview questions, and companies hiring.
35 min readLand Your Remote Job Faster
Get the latest remote job strategies, salary data, and insider tips delivered to your inbox.